Market Outlook
June 16, 2017
Market Cues
Domestic Indices
Chg (%)
(Pts)
(Close)
Indian markets are likely to trade in positive zone tracking the SGX Nifty and Asian
BSE Sensex
(0.3)
(80)
31,076
markets.
Nifty
(0.4)
(40)
9,578
Following the mixed performance seen in the previous session, US markets moved
Mid Cap
(0.1)
(18)
14,782
mostly lower during trading on Thursday. The major averages regained ground after
Small Cap
0.4
157
15,646
an early move to the downside but remained stuck in negative territory. The
weakness on Wall Street came as traders continued to digest the Federal Reserve's
Bankex
(0.4)
(108)
26,462
decision to raise interest rates by a quarter point on Wednesday.
Global Indices
Chg (%)
(Pts)
(Close)
The European markets ended Thursday's session solidly in negative territory, adding
to the losses of the previous session. Investors had their first opportunity to react to
Dow Jones
(0.1)0.9
(15)74
21,360
yesterday's announcement from the Federal Reserve. The Fed not only hiked interest
Nasdaq
(0.5)0.9
(29)54
6,1667
rates, but stated that they are planning one more rate hike this year. The hawkish
FTSE
(0.7)0.1
(55)
4
7,4199
tone of the central bank has traders concerned, as U.S. economic data has been
Nikkei
(0.3)
(52)
19,832
weak of late.
Hang Seng
(1.2)
(311)
25,565
Indian markets snapped a two-day winning streak to end modestly lower on
Shanghai Com
0.1
2
3,132
Thursday, with a relatively hawkish Fed and a widening probe into Russia's role in
the U.S. election denting investor sentiment.
Advances / Declines
BSE
NSE
News Analysis
Advances
1,374
1,835
RIL-BP to invest `40,000cr more to raise KG-D6 gas output to 35 mscmd
Declines
1,305
844
Detailed analysis on Pg2
Unchanged
158
75
Investor’s Ready Reckoner
Volumes (` Cr)
Key Domestic & Global Indicators
BSE
3,339
Stock Watch: Latest investment recommendations on 150+ stocks
NSE
23,944
Refer Pg5 onwards
Top Picks
#Net Inflows (` Cr)
Net
Mtd
Ytd
CMP
Target
Upside
Company
Sector
Rating
(`)
(`)
(%)
FII
(56586
(23,501
55,470
Blue Star
Capital Goods
Buy
659
760
15.3
MFs
804(9)
2,412
32,451
Dewan Housing Fin. Financials
Accumulate
463
520
12.3
Mahindra Lifespace Real Estate
Buy
443
522
17.8
Top Gainers
Price (`)
Chg (%)
Navkar Corporation Others
Buy
217
265
22.3
Sciiacem
185
7.6
KEI Industries
Capital Goods
Buy
212
258
21.6
More Top Picks on Pg3
Auropharma
643
6.9
Ibrealest
198
6.4
Key Upcoming Events
Previous
Consensus
Jpassociat
14
5.9
Date
Region
Event Description
Reading
Expectations
Fortis
198
5.8
Jun 16, 2017 US
Building permits
1,228.00
1,249.00
Jun 16, 2017 Euro Zone Euro-Zone CPI (YoY)
1.40
1.40
Top Losers
Price (`)
Chg (%)
Jun 16, 2017 US
Housing Starts
1,172.00
1,220.00
Jun 21, 2017 US
Existing home sales
5.57
5.55
Hindpetro
519
(5.0)
Jun 22, 2017 Euro Zone Euro-Zone Consumer Confidence
(3.30)
Videoind
23
(4.9)
Jun 23, 2017 Germany PMI Services
55.40
Cub
179
(4.7)
More Events on Pg4
Natcopharm
971
(3.3)
Bpcl
670
(3.1)
#as on 15th June, 2017
Market Outlook
June 16, 2017
News Analysis
RIL-BP to invest `40,000cr more to raise KG-D6 gas output to 35
mscmd
Reliance Industries Chairman Mukesh Ambani and BP Plc Chief Executive Bob
Dudley on Thursday announced at a press conference that their companies would
invest `40,000cr more in partnership to increase KG-D6 gas output to 30-35
mscmd. The partners would progress on R-Series gas field development in the KG-
D6 block, Dudley said, adding the gas project would reduce India's import
dependence by 10 per cent.
Economic and Political News
Sack employees who got jobs with fake caste certificates: Govt
Civil Aviation Ministry seeks two-months deferment of GST rollout
Oil imports from Iran plunge to lowest level since June over gas field row
China-led AIIB grants $150 mn loan for India Infrastructure Fund
Current account deficit soars to $3.4 bn as imports jump in Q4
Centre to reduce stake in MSTC to 64% from 90%
Bihar to invest `20,000cr in 5 years to generate 3,000 Mw clean energy
Corporate News
Amul turnover crosses `27k mark; farmer income up four times in 7 years
Warburg Pincus to acquire 43% stake in Tata Technologies for $360mn
HCL to hire 2,000 at upcoming Nagpur campus
India Inc's overseas investment drops 56% in May
Market Outlook
June 16, 2017
Top Picks ★★★★★
Market Cap
CMP
Target
Upside
Company
Rationale
(` Cr)
(`)
(`)
(%)
Strong growth in domestic business due to its leadership
in acute therapeutic segment. Alkem expects to launch
Alkem Laboratories
22,283
1,864
2,161
16.0
more products in USA, which bodes for its international
business.
We expect the company would report strong profitability
Asian Granito
1,229
409
447
9.4
owing to better product mix, higher B2C sales and
amalgamation synergy.
Favourable outlook for the AC industry to augur well for
Cooling products business which is out pacing the market
Blue Star
6,302
659
760
15.3
growth. EMPPAC division's profitability to improve once
operating environment turns around.
With a focus on the low and medium income (LMI)
consumer segment, the company has increased its
Dewan Housing Finance
14,516
463
520
12.3
presence in tier-II & III cities where the growth opportunity
is immense.
Loan growth is likely to pick up after a sluggish FY17.
Karur Vysya Bank
8,518
141
160
13.5
Lower credit cost will help in strong bottomline growth.
Increasing share of CASA will help in NIM improvement.
Economic recovery to have favourable impact on
advertising & circulation revenue growth. Further, the
Jagran Prakashan
5,968
183
225
23.2
acquisition of a radio business (Radio City) would also
boost the company's revenue growth.
High order book execution in EPC segment, rising B2C
KEI Industries
1,651
212
258
21.6
sales and higher exports to boost the revenues and
profitability
Speedier execution and speedier sales, strong revenue
Mahindra Lifespace
2,274
443
522
17.8
visibilty in short-to-long run, attractive valuations
Massive capacity expansion along with rail advantage at
Navkar Corporation
3,090
217
265
22.3
ICD as well CFS augurs well for the company
Strong brands and distribution network would boost
Siyaram Silk Mills
2,112
2,253
2,500
11.0
growth going ahead. Stock currently trades at an
inexpensive valuation.
Market leadership in Hindi news genre and no.
2
viewership ranking in English news genre, exit from the
TV Today Network
1,550
260
344
32.4
radio business, and anticipated growth in ad spends by
corporates to benefit the stock.
Source: Company, Angel Research
Market Outlook
June 16, 2017
Key Upcoming Events
Global economic events release calendar
Bloomberg Data
Date
Time
Country
Event Description
Unit
Period
Last Reported
Estimated
Jun 16, 2017
6:00 PMUS
Building permits
Thousands
May
1,228.00
1,249.00
2:30 PMEuro Zone Euro-Zone CPI (YoY)
%
May F
1.40
1.40
6:00 PMUS
Housing Starts
Thousands
May
1,172.00
1,220.00
Jun 21, 2017
7:30 PMUS
Existing home sales
Million
May
5.57
5.55
Jun 22, 2017
7:30 PMEuro Zone Euro-Zone Consumer Confidence
Value
Jun A
(3.30)
Jun 23, 2017
1:00 PMGermany PMI Services
Value
Jun P
55.40
1:00 PMGermany PMI Manufacturing
Value
Jun P
59.50
7:30 PMUS
New home sales
Thousands
May
569.00
600.00
Jun 27, 2017
7:30 PMUS
Consumer Confidence
S.A./ 1985=100 Jun
117.90
Jun 29, 2017
6:00 PMUS
GDP Qoq (Annualised)
% Change
1Q T
1.20
Jun 30, 2017
1:25 PMGermany Unemployment change (000's)
Thousands
Jun
(9.00)
6:30 AMChina
PMI Manufacturing
Value
Jun
51.20
2:00 PMUK
PMI Manufacturing
Value
Jun
56.70
Jul 03, 2017
2:00 PMUK
GDP (YoY)
% Change
1Q F
2.00
Jul 07, 2017
2:00 PMUK
Industrial Production (YoY)
% Change
May
(0.80)
6:00 PMUS
Change in Nonfarm payrolls
Thousands
Jun
138.00
6:00 PMUS
Unnemployment rate
%
Jun
4.30
Jul 10, 2017
7:00 AMChina
Consumer Price Index (YoY)
% Change
Jun
1.50
Jul 12, 2017
2:00 PMUK
Jobless claims change
% Change
Jun
7.30
5:30 PMIndia
Industrial Production YoY
% Change
May
3.10
Jul 13, 2017
US
Producer Price Index (mom)
% Change
Jun
(0.70)
China
Exports YoY%
% Change
Jun
8.70
Source: Bloomberg, Angel Research
Market Outlook
June 16, 2017
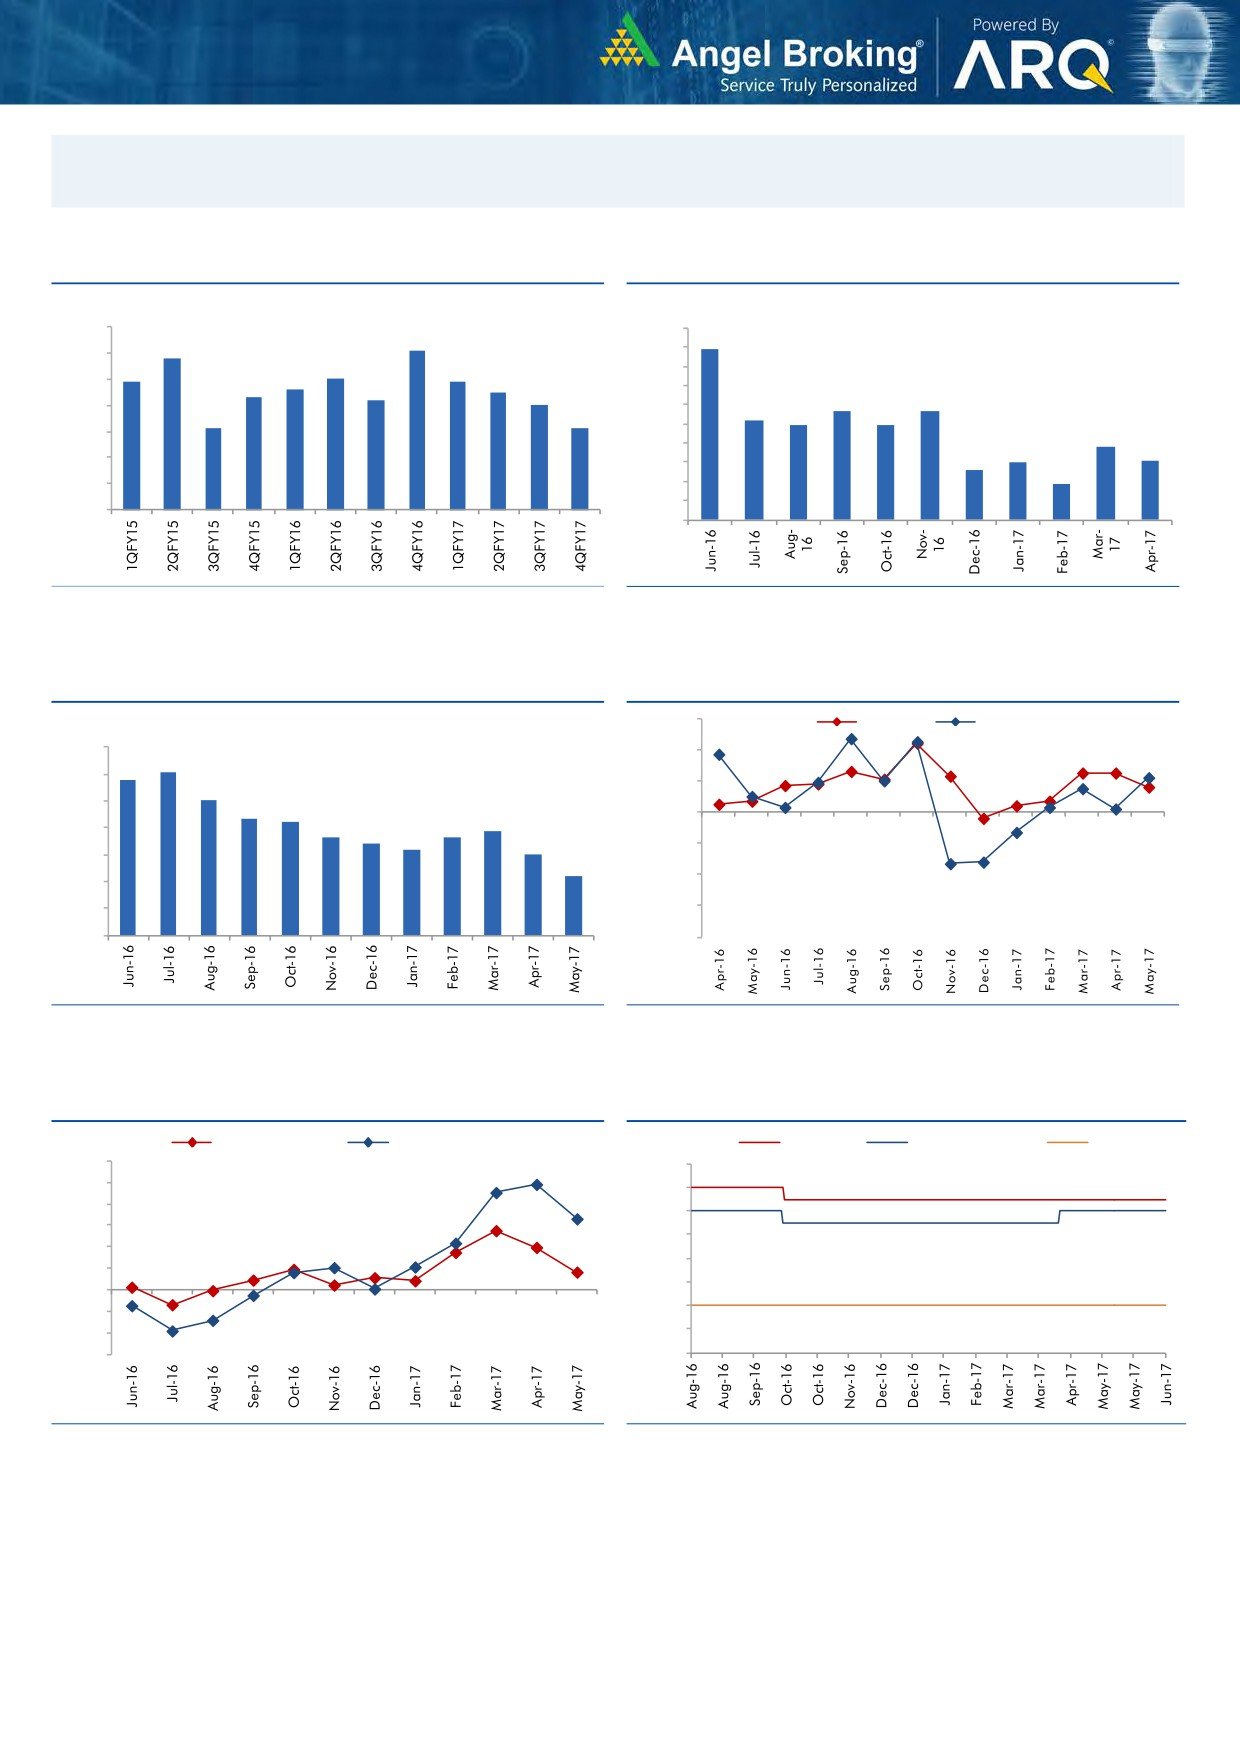
Macro watch
Exhibit 1: Quarterly GDP trends
Exhibit 2: IIP trends
(%)
(%)
10.0
10.0
9.1
8.9
8.8
9.0
9.0
7.9
8.0
7.9
8.0
7.6
7.5
8.0
7.3
7.2
7.0
7.0
5.7
5.7
7.0
6.0
5.2
6.1
6.1
4.9
4.9
5.0
6.0
3.8
4.0
3.0
3.1
5.0
2.6
3.0
1.9
4.0
2.0
1.0
3.0
-
Source: CSO, Angel Research
Source: MOSPI, Angel Research
Exhibit 3: Monthly CPI inflation trends
Exhibit 4: Manufacturing and services PMI
56.0
Mfg. PMI
Services PMI
(%)
7.0
54.0
6.1
5.8
6.0
5.1
52.0
5.0
4.3
4.2
3.9
50.0
3.6
3.7
4.0
3.4
3.2
3.0
48.0
3.0
2.2
46.0
2.0
1.0
44.0
-
42.0
Source: MOSPI, Angel Research
Source: Market, Angel Research; Note: Level above 50 indicates expansion
Exhibit 5: Exports and imports growth trends
Exhibit 6: Key policy rates
(%)
Exports yoy growth
Imports yoy growth
(%)
Repo rate
Reverse Repo rate
CRR
60.0
7.00
50.0
6.50
40.0
6.00
30.0
5.50
20.0
5.00
10.0
4.50
0.0
4.00
(10.0)
(20.0)
3.50
(30.0)
3.00
Source: Bloomberg, Angel Research
Source: RBI, Angel Research
Market Outlook
June 16, 2017
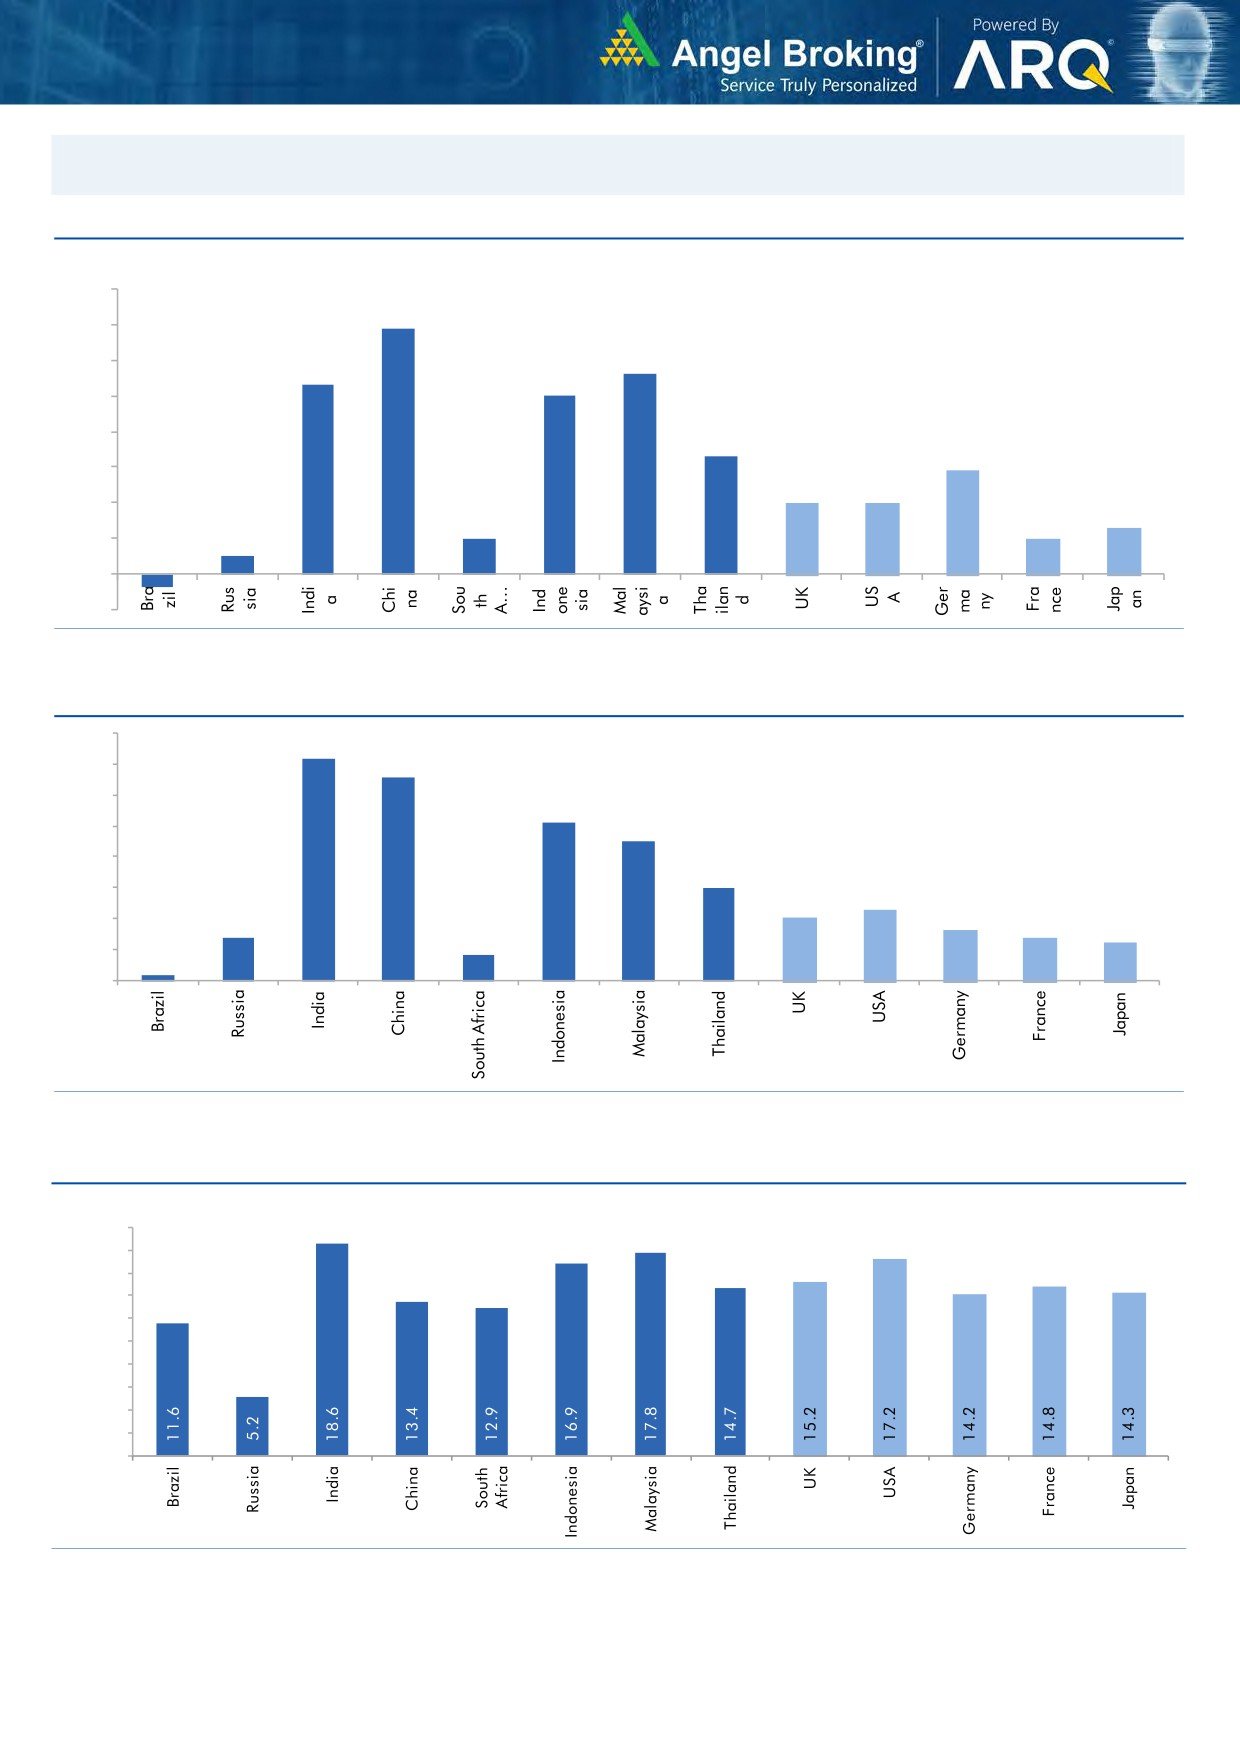
Global watch
Exhibit 1: Latest quarterly GDP Growth (%, yoy) across select developing and developed countries
(%)
8.0
6.9
7.0
6.0
5.6
5.3
5.0
5.0
1.0
4.0
3.3
2.9
3.0
2.0
2.0
2.0
0.5
1.3
1.0
1.0
-
(1.0)
(0.4)
Source: Bloomberg, Angel Research
Exhibit 2: 2016 GDP Growth projection by IMF (%, yoy) across select developing and developed countries
(%)
7.2
6.6
7.0
6.0
5.1
5.0
4.5
4.0
3.0
3.0
2.3
2.0
1.4
1.6
2.0
1.4
1.2
0.2
0.8
1.0
-
Source: IMF, Angel Research
Exhibit 3: One year forward P-E ratio across select developing and developed countries
(x)
20.0
18.0
16.0
14.0
12.0
10.0
8.0
6.0
4.0
2.0
-
Source: IMF, Angel Research
Market Outlook
June 16, 2017
Exhibit 4: Relative performance of indices across globe
Returns (%)
Country
Name of index
Closing price
1M
3M
1YR
Brazil
Bovespa
61,923
(9.6)
(5.5)
24.7
Russia
Micex
1,818
(9.3)
(9.1)
(3.2)
India
Nifty
9,578
0.7
5.4
17.2
China
Shanghai Composite
3,132
1.2
(3.4)
7.0
South Africa
Top 40
44,512
(6.1)
0.5
(4.1)
Mexico
Mexbol
49,140
(0.6)
4.3
8.7
Indonesia
LQ45
970
1.9
8.5
16.7
Malaysia
KLCI
1,790
0.6
3.9
7.8
Thailand
SET 50
990
0.5
1.7
7.2
USA
Dow Jones
21,360
1.8
2.0
20.5
UK
FTSE
7,419
(0.5)
0.7
23.2
Japan
Nikkei
19,832
(0.4)
1.0
17.8
Germany
DAX
12,692
(0.9)
5.9
26.7
France
CAC
5,217
(3.5)
4.9
16.8
Source: Bloomberg, Angel Research
Stock Watch
June 16, 2017
Company Name
Reco
CMP
Target
Mkt Cap
Sales ( Čcr )
OPM(%)
EPS (Č)
PER(x)
P/BV(x)
RoE(%)
EV/Sales(x)
(Č)
Price ( Č)
( Č cr )
FY17E FY18E
FY17E
FY18E
FY17E
FY18E
FY17E
FY18E
FY17E
FY18E
FY17E
FY18E
FY17E
FY18E
Agri / Agri Chemical
Rallis
Neutral
245
-
4,771
1,937
2,164
13.3
14.3
9.0
11.0
27.3
22.3
4.8
4.1
18.4
19.8
2.5
2.2
United Phosphorus
Neutral
856
-
43,460
15,176
17,604
18.5
18.5
37.4
44.6
22.9
19.2
4.5
3.7
21.4
21.2
3.0
2.5
Auto & Auto Ancillary
Ashok Leyland
Buy
94
111
26,837
20,021
21,915
11.6
11.9
4.5
5.3
21.0
17.7
4.3
3.8
20.6
21.5
1.3
1.1
Bajaj Auto
Neutral
2,815
-
81,470
25,093
27,891
19.5
19.2
143.9
162.5
19.6
17.3
5.5
4.7
30.3
29.4
3.0
2.6
Bharat Forge
Neutral
1,164
-
27,108
7,726
8,713
20.5
21.2
35.3
42.7
33.0
27.3
6.1
5.5
18.9
20.1
3.6
3.1
Eicher Motors
Neutral
28,780
-
78,345
16,583
20,447
17.5
18.0
598.0
745.2
48.1
38.6
16.4
12.5
41.2
38.3
4.6
3.6
Gabriel India
Neutral
151
-
2,168
1,544
1,715
9.0
9.3
5.4
6.3
27.9
24.0
5.3
4.7
18.9
19.5
1.4
1.2
Hero Motocorp
Neutral
3,779
-
75,472
28,083
30,096
15.3
15.7
171.8
187.0
22.0
20.2
7.7
6.5
30.1
27.9
2.5
2.3
Jamna Auto Industries Neutral
278
-
2,218
1,486
1,620
9.8
9.9
15.0
17.2
18.6
16.2
4.1
3.4
21.8
21.3
1.6
1.4
L G Balakrishnan & Bros Neutral
751
-
1,179
1,302
1,432
11.6
11.9
43.7
53.0
17.2
14.2
2.4
2.2
13.8
14.2
1.0
0.9
Mahindra and Mahindra Neutral
1,389
-
86,254
46,534
53,077
11.6
11.7
67.3
78.1
20.6
17.8
3.4
2.9
15.4
15.8
1.8
1.6
Maruti
Neutral
7,311
-
220,858
67,822
83,288
16.0
16.4
253.8
312.4
28.8
23.4
6.6
5.4
23.0
22.9
2.9
2.3
Minda Industries
Neutral
596
-
5,153
2,728
3,042
9.0
9.1
68.2
86.2
8.7
6.9
2.0
1.6
23.8
24.3
2.0
1.7
Motherson Sumi
Neutral
476
-
66,865
45,896
53,687
7.8
8.3
13.0
16.1
36.5
29.6
11.8
9.4
34.7
35.4
1.5
1.3
Rane Brake Lining
Neutral
1,336
-
1,058
511
562
11.3
11.5
28.1
30.9
47.6
43.2
7.3
6.6
15.3
15.0
2.2
2.0
Setco Automotive
Neutral
38
-
508
741
837
13.0
13.0
15.2
17.0
2.5
2.2
0.4
0.4
15.8
16.3
1.1
1.0
Tata Motors
Neutral
448
-
129,483
300,209
338,549
8.9
8.4
42.7
54.3
10.5
8.3
1.7
1.4
15.6
17.2
0.5
0.5
TVS Motor
Neutral
542
-
25,750
13,390
15,948
6.9
7.1
12.8
16.5
42.5
32.8
10.6
8.4
26.3
27.2
2.0
1.6
Amara Raja Batteries
Buy
837
1,009
14,303
5,305
6,100
16.0
16.3
28.4
34.0
29.5
24.6
5.7
4.8
19.3
19.3
2.7
2.3
Exide Industries
Neutral
221
-
18,789
7,439
8,307
15.0
15.0
8.1
9.3
27.3
23.8
3.8
3.4
14.3
16.7
2.1
1.9
Apollo Tyres
Neutral
257
-
13,095
12,877
14,504
14.3
13.9
21.4
23.0
12.0
11.2
1.9
1.6
16.4
15.2
1.2
1.1
Ceat
Neutral
1,873
-
7,575
7,524
8,624
13.0
12.7
131.1
144.3
14.3
13.0
2.6
2.2
19.8
18.6
1.1
0.9
JK Tyres
Neutral
175
-
3,965
7,455
8,056
15.0
15.0
21.8
24.5
8.0
7.1
1.7
1.4
22.8
21.3
0.7
0.6
Swaraj Engines
Neutral
2,339
-
2,904
660
810
15.2
16.4
54.5
72.8
42.9
32.1
13.4
12.1
31.5
39.2
4.2
3.4
Subros
Neutral
259
-
1,554
1,488
1,681
11.7
11.9
6.4
7.2
40.5
36.1
4.3
3.9
10.8
11.4
1.3
1.1
Indag Rubber
Neutral
222
-
584
286
326
19.8
16.8
11.7
13.3
19.0
16.7
3.2
3.0
17.8
17.1
1.7
1.5
Capital Goods
ACE
Neutral
74
-
734
709
814
4.1
4.6
1.4
2.1
53.0
35.3
2.2
2.1
4.4
6.0
1.2
1.0
BEML
Neutral
1,352
-
5,629
3,451
4,055
6.3
9.2
31.4
57.9
43.1
23.3
2.6
2.4
6.3
10.9
1.8
1.5
Bharat Electronics
Neutral
167
-
37,246
8,137
9,169
16.8
17.2
58.7
62.5
2.8
2.7
0.4
0.4
44.6
46.3
3.6
3.2
Stock Watch
June 16, 2017
Company Name
Reco
CMP
Target
Mkt Cap
Sales ( Čcr )
OPM(%)
EPS (Č)
PER(x)
P/BV(x)
RoE(%)
EV/Sales(x)
(Č)
Price ( Č)
( Č cr )
FY17E
FY18E
FY17E
FY18E
FY17E
FY18E
FY17E
FY18E
FY17E
FY18E
FY17E
FY18E
FY17E
FY18E
Capital Goods
Voltas
Neutral
494
-
16,339
6,511
7,514
7.9
8.7
12.9
16.3
38.3
30.3
6.9
6.0
16.7
18.5
2.3
1.9
BGR Energy
Neutral
153
-
1,104
16,567
33,848
6.0
5.6
7.8
5.9
19.6
25.9
1.1
1.1
4.7
4.2
0.2
0.1
BHEL
Neutral
139
-
34,058
28,797
34,742
-
2.8
2.3
6.9
60.5
20.2
1.0
1.0
1.3
4.8
0.8
0.6
Blue Star
Buy
659
760
6,302
4,283
5,077
5.9
7.3
14.9
22.1
44.3
29.8
8.6
7.2
20.4
26.4
1.5
1.3
CG Power and Industrial
Neutral
82
-
5,155
5,777
6,120
5.9
7.0
3.3
4.5
24.9
18.3
1.1
1.0
4.4
5.9
0.8
0.7
Solutions
Greaves Cotton
Neutral
166
-
4,049
1,755
1,881
16.8
16.9
7.8
8.5
21.3
19.5
4.3
4.0
20.6
20.9
2.0
1.8
Inox Wind
Neutral
144
-
3,192
5,605
6,267
15.7
16.4
24.8
30.0
5.8
4.8
1.6
1.2
25.9
24.4
0.6
0.5
KEC International
Neutral
250
-
6,427
9,294
10,186
7.9
8.1
9.9
11.9
25.3
21.0
3.7
3.2
15.6
16.3
0.9
0.8
KEI Industries
Buy
212
258
1,651
2,633
3,001
10.4
10.0
12.7
13.0
16.7
16.3
3.6
3.0
21.4
18.2
0.8
0.7
Thermax
Neutral
962
-
11,465
5,421
5,940
7.3
7.3
25.7
30.2
37.4
31.9
4.5
4.1
12.2
13.1
2.0
1.8
VATech Wabag
Neutral
690
-
3,765
3,136
3,845
8.9
9.1
26.0
35.9
26.5
19.2
3.3
2.8
13.4
15.9
1.1
0.9
Cement
ACC
Neutral
1,609
-
30,219
11,225
13,172
13.2
16.9
44.5
75.5
36.2
21.3
3.4
3.2
11.2
14.2
2.7
2.3
Ambuja Cements
Neutral
236
-
46,851
9,350
10,979
18.2
22.5
5.8
9.5
40.7
24.8
3.4
3.1
10.2
12.5
5.0
4.3
India Cements
Neutral
211
-
6,483
4,364
4,997
18.5
19.2
7.9
11.3
26.7
18.7
1.9
1.9
8.0
8.5
2.2
2.0
JK Cement
Neutral
1,030
-
7,198
4,398
5,173
15.5
17.5
31.2
55.5
33.0
18.6
4.0
3.4
12.0
15.5
2.2
1.8
J K Lakshmi Cement
Neutral
481
-
5,656
2,913
3,412
14.5
19.5
7.5
22.5
64.1
21.4
3.9
3.3
12.5
18.0
2.5
2.1
Orient Cement
Neutral
148
-
3,038
2,114
2,558
18.5
20.5
8.1
11.3
18.3
13.1
2.7
2.3
9.0
14.0
2.1
1.6
UltraTech Cement
Neutral
4,047
-
111,090
25,768
30,385
21.0
23.5
111.0
160.0
36.5
25.3
4.7
4.1
13.5
15.8
4.4
3.7
Construction
ITNL
Neutral
98
-
3,225
8,946
10,017
31.0
31.6
8.1
9.1
12.1
10.8
0.5
0.5
4.2
5.0
3.7
3.4
KNR Constructions
Neutral
207
-
2,905
1,385
1,673
14.7
14.0
41.2
48.5
5.0
4.3
0.9
0.8
14.9
15.2
2.2
1.8
Larsen & Toubro
Neutral
1,736
-
162,022
111,017
124,908
11.0
11.0
61.1
66.7
28.4
26.0
3.4
3.2
13.1
12.9
2.5
2.3
Gujarat Pipavav Port
Neutral
148
-
7,136
705
788
52.2
51.7
5.0
5.6
29.5
26.4
2.9
2.6
11.2
11.2
9.8
8.3
Nagarjuna Const.
Neutral
91
-
5,034
8,842
9,775
9.1
8.8
5.3
6.4
17.1
14.2
1.4
1.2
8.2
9.1
0.7
0.6
PNC Infratech
Neutral
147
-
3,760
2,350
2,904
13.1
13.2
9.0
8.8
16.3
16.7
0.6
0.5
15.9
13.9
1.7
1.4
Simplex Infra
Neutral
523
-
2,585
6,829
7,954
10.5
10.5
31.4
37.4
16.6
14.0
1.7
1.6
9.9
13.4
0.8
0.7
Power Mech Projects
Neutral
602
-
885
1,801
2,219
12.7
14.6
72.1
113.9
8.3
5.3
1.5
1.3
16.8
11.9
0.5
0.4
Sadbhav Engineering
Neutral
307
-
5,273
3,598
4,140
10.3
10.6
9.0
11.9
34.2
25.8
3.6
3.1
9.9
11.9
1.8
1.5
NBCC
Neutral
198
-
17,793
7,428
9,549
7.9
8.6
8.2
11.0
24.1
18.0
1.2
1.0
28.2
28.7
2.1
1.6
MEP Infra
Neutral
92
-
1,491
1,877
1,943
30.6
29.8
3.0
4.2
30.6
21.8
14.8
10.0
0.6
0.6
2.2
2.0
Stock Watch
June 16, 2017
Company Name
Reco
CMP
Target
Mkt Cap
Sales ( Čcr )
OPM(%)
EPS (Č)
PER(x)
P/BV(x)
RoE(%)
EV/Sales(x)
(Č)
Price ( Č)
( Č cr )
FY17E
FY18E
FY17E
FY18E
FY17E
FY18E
FY17E
FY18E
FY17E
FY18E
FY17E
FY18E
FY17E
FY18E
Construction
SIPL
Neutral
111
-
3,892
1,036
1,252
65.5
66.2
(8.4)
(5.6)
4.1
4.7
(22.8)
(15.9)
12.0
10.0
Engineers India
Neutral
158
-
10,671
1,725
1,935
16.0
19.1
11.4
13.9
13.9
11.4
1.9
1.9
13.4
15.3
5.1
4.6
Financials
Axis Bank
Accumulate
508
580
121,771
46,932
53,575
3.5
3.4
32.4
44.6
15.7
11.4
2.0
1.8
13.6
16.5
-
-
Bank of Baroda
Neutral
170
-
39,079
19,980
23,178
1.8
1.8
11.5
17.3
14.8
9.8
1.7
1.4
8.3
10.1
-
-
Canara Bank
Neutral
352
-
21,031
15,225
16,836
1.8
1.8
14.5
28.0
24.3
12.6
1.7
1.4
5.8
8.5
-
-
Can Fin Homes
Neutral
3,122
-
8,311
420
526
3.5
3.5
86.5
107.8
36.1
29.0
7.8
6.4
23.6
24.1
-
-
Cholamandalam Inv. &
Accumulate
1,114
1,230
17,415
2,012
2,317
6.3
6.3
42.7
53.6
26.1
20.8
4.1
3.5
16.9
18.3
-
-
Fin. Co.
Dewan Housing Finance Accumulate
463
520
14,516
2,225
2,688
2.9
2.9
29.7
34.6
15.6
13.4
2.5
1.7
16.1
14.8
-
-
Equitas Holdings
Buy
152
235
5,149
939
1,281
11.7
11.5
5.8
8.2
26.3
18.6
2.3
2.0
10.9
11.5
-
-
Federal Bank
Neutral
119
-
20,554
8,259
8,995
3.0
3.0
4.3
5.6
27.7
21.3
2.3
2.2
8.5
10.1
-
-
HDFC
Neutral
1,638
-
260,307
11,475
13,450
3.4
3.4
45.3
52.5
36.2
31.2
7.0
6.2
20.2
20.5
-
-
HDFC Bank
Neutral
1,662
-
426,938
46,097
55,433
4.5
4.5
58.4
68.0
28.5
24.4
5.0
4.2
18.8
18.6
-
-
ICICI Bank
Neutral
317
-
184,748
42,800
44,686
3.1
3.3
18.0
21.9
17.6
14.5
2.4
2.2
11.1
12.3
-
-
Karur Vysya Bank
Accumulate
141
160
8,518
5,640
6,030
3.3
3.2
8.9
10.0
15.8
14.1
1.7
1.6
11.2
11.4
-
-
Lakshmi Vilas Bank
Neutral
194
-
3,726
3,339
3,799
2.7
2.8
11.0
14.0
17.7
13.9
1.8
1.7
11.2
12.7
-
-
LIC Housing Finance
Neutral
777
-
39,197
3,712
4,293
2.6
2.5
39.0
46.0
19.9
16.9
3.7
3.2
19.9
20.1
-
-
Punjab Natl.Bank
Neutral
148
-
31,409
23,532
23,595
2.3
2.4
6.8
12.6
21.7
11.7
3.4
2.4
3.3
6.5
-
-
RBL Bank
Neutral
514
-
19,349
1,783
2,309
2.6
2.6
12.7
16.4
40.5
31.3
4.4
3.9
12.8
13.3
-
-
Repco Home Finance
Neutral
901
-
5,639
388
457
4.5
4.2
30.0
38.0
30.1
23.7
5.0
4.2
18.0
19.2
-
-
South Ind.Bank
Neutral
29
-
5,266
6,435
7,578
2.5
2.5
2.7
3.1
10.8
9.4
1.4
1.2
10.1
11.2
-
-
St Bk of India
Neutral
284
-
230,360
88,650
98,335
2.6
2.6
13.5
18.8
21.0
15.1
2.0
1.8
7.0
8.5
-
-
Union Bank
Neutral
153
-
10,525
13,450
14,925
2.3
2.3
25.5
34.5
6.0
4.4
0.9
0.8
7.5
10.2
-
-
Yes Bank
Neutral
1,446
-
66,120
8,978
11,281
3.3
3.4
74.0
90.0
19.5
16.1
3.7
3.1
17.0
17.2
-
-
FMCG
Akzo Nobel India
Neutral
1,915
-
9,183
2,955
3,309
13.3
13.7
57.2
69.3
33.5
27.6
10.9
9.2
32.7
33.3
2.9
2.6
Asian Paints
Neutral
1,141
-
109,464
17,128
18,978
16.8
16.4
19.1
20.7
59.8
55.1
20.8
19.6
34.8
35.5
6.3
5.7
Britannia
Neutral
3,563
-
42,755
9,594
11,011
14.6
14.9
80.3
94.0
44.4
37.9
18.2
14.1
41.2
-
4.3
3.7
Colgate
Neutral
1,079
-
29,342
4,605
5,149
23.4
23.4
23.8
26.9
45.3
40.1
25.1
19.6
64.8
66.8
6.3
5.6
Dabur India
Accumulate
289
304
50,820
8,315
9,405
19.8
20.7
8.1
9.2
35.6
31.4
9.9
8.2
31.6
31.0
5.8
5.1
GlaxoSmith Con*
Neutral
5,350
-
22,500
4,350
4,823
21.2
21.4
179.2
196.5
29.9
27.2
7.9
6.7
27.1
26.8
4.6
4.0
Stock Watch
June 16, 2017
Company Name
Reco
CMP
Target
Mkt Cap
Sales ( Čcr )
OPM(%)
EPS (Č)
PER(x)
P/BV(x)
RoE(%)
EV/Sales(x)
(Č)
Price ( Č)
( Č cr )
FY17E FY18E
FY17E
FY18E
FY17E
FY18E
FY17E
FY18E
FY17E
FY18E
FY17E
FY18E
FY17E
FY18E
FMCG
Godrej Consumer
Neutral
1,869
-
63,645
10,235
11,428
18.4
18.6
41.1
44.2
45.5
42.3
10.1
8.5
24.9
24.8
6.3
5.6
HUL
Neutral
1,104
-
238,859
35,252
38,495
17.8
17.8
20.7
22.4
53.5
49.3
51.1
43.8
95.6
88.9
6.6
6.1
ITC
Neutral
302
-
366,729
40,059
44,439
38.3
39.2
9.0
10.1
33.6
29.8
9.4
8.2
27.8
27.5
8.7
7.8
Marico
Neutral
315
-
40,630
6,430
7,349
18.8
19.5
6.4
7.7
49.2
40.9
14.9
12.5
33.2
32.5
6.1
5.3
Nestle*
Neutral
6,677
-
64,377
10,073
11,807
20.7
21.5
124.8
154.2
53.5
43.3
22.0
19.8
34.8
36.7
6.2
5.3
Tata Global
Neutral
159
-
10,035
8,675
9,088
9.8
9.8
7.4
8.2
21.5
19.4
1.7
1.6
7.9
8.1
1.1
1.0
Procter & Gamble
Neutral
7,895
-
25,628
2,939
3,342
23.2
23.0
146.2
163.7
54.0
48.2
13.7
11.4
25.3
23.5
8.3
7.2
Hygiene
IT
HCL Tech^
Buy
846
1,014
120,723
46,723
52,342
22.1
20.9
60.0
62.8
14.1
13.5
3.6
3.0
25.3
22.4
2.3
2.0
Infosys
Buy
952
1,179
218,738
68,484
73,963
26.0
26.0
63.0
64.0
15.1
14.9
3.2
2.9
20.8
19.7
2.9
2.5
TCS
Accumulate
2,411
2,651
475,090
117,966
127,403
27.5
27.6
134.3
144.5
18.0
16.7
5.4
5.0
29.8
29.7
3.7
3.4
Tech Mahindra
Buy
394
533
38,420
29,141
31,051
14.4
15.0
32.3
35.6
12.2
11.1
2.1
1.9
17.1
17.0
1.2
1.0
Wipro
Buy
261
570
126,909
55,421
58,536
20.3
20.3
35.1
36.5
7.4
7.2
1.3
1.1
19.2
14.6
1.7
1.5
Media
D B Corp
Neutral
372
-
6,843
2,297
2,590
27.4
28.2
21.0
23.4
17.7
15.9
4.1
3.6
23.7
23.1
2.8
2.4
HT Media
Neutral
81
-
1,881
2,693
2,991
12.6
12.9
7.9
9.0
10.2
9.0
0.9
0.8
7.8
8.3
0.3
0.2
Jagran Prakashan
Buy
183
225
5,968
2,283
2,555
28.0
28.0
10.6
12.3
17.2
14.9
3.7
3.2
21.4
21.4
2.6
2.3
Sun TV Network
Neutral
825
-
32,500
2,850
3,265
70.1
71.0
26.2
30.4
31.5
27.1
8.1
7.1
24.3
25.6
11.0
9.5
Hindustan Media
Neutral
274
-
2,011
1,016
1,138
24.3
25.2
27.3
30.1
10.0
9.1
1.9
1.7
16.2
15.8
1.3
1.1
Ventures
TV Today Network
Buy
260
344
1,550
608
667
21.5
22.3
15.7
19.2
16.6
13.5
2.5
2.2
16.1
16.0
2.1
1.8
Metals & Mining
Coal India
Neutral
254
-
157,916
84,638
94,297
21.4
22.3
24.5
27.1
10.4
9.4
4.3
4.1
42.6
46.0
1.4
1.2
Hind. Zinc
Neutral
243
-
102,612
14,252
18,465
55.9
48.3
15.8
21.5
15.4
11.3
2.5
2.2
17.0
20.7
7.2
5.6
Hindalco
Neutral
197
-
44,105
107,899
112,095
7.4
8.2
9.2
13.0
21.4
15.1
1.0
1.0
4.8
6.6
0.9
0.9
JSW Steel
Neutral
197
-
47,595
53,201
58,779
16.1
16.2
130.6
153.7
1.5
1.3
0.2
0.2
14.0
14.4
1.7
1.4
NMDC
Neutral
113
-
35,610
6,643
7,284
44.4
47.7
7.1
7.7
15.9
14.6
1.4
1.3
8.8
9.2
3.1
2.8
SAIL
Neutral
56
-
23,294
47,528
53,738
(0.7)
2.1
(1.9)
2.6
21.7
0.6
0.6
(1.6)
3.9
1.3
1.2
Vedanta
Neutral
236
-
87,689
71,744
81,944
19.2
21.7
13.4
20.1
17.6
11.7
1.5
1.4
8.4
11.3
1.6
1.3
Tata Steel
Neutral
503
-
48,818
121,374
121,856
7.2
8.4
18.6
34.3
27.0
14.7
1.7
1.5
6.1
10.1
1.0
1.0
Oil & Gas
GAIL
Neutral
377
-
63,703
56,220
65,198
9.3
10.1
27.1
33.3
13.9
11.3
1.3
1.2
9.3
10.7
1.3
1.1
ONGC
Neutral
168
-
214,957
137,222
152,563
15.0
21.8
19.5
24.1
8.6
7.0
0.7
0.7
8.5
10.1
1.8
1.6
Indian Oil Corp
Neutral
407
-
197,660
373,359
428,656
5.9
5.5
54.0
59.3
7.5
6.9
1.2
1.1
16.0
15.6
0.7
0.6
Stock Watch
June 16, 2017
Company Name
Reco
CMP
Target
Mkt Cap
Sales ( Čcr )
OPM(%)
EPS (Č)
PER(x)
P/BV(x)
RoE(%)
EV/Sales(x)
(Č)
Price ( Č)
( Č cr )
FY17E FY18E
FY17E
FY18E
FY17E
FY18E
FY17E
FY18E
FY17E
FY18E
FY17E
FY18E
FY17E
FY18E
Oil & Gas
Reliance Industries
Neutral
1,385
-
450,161
301,963
358,039
12.1
12.6
87.7
101.7
15.8
13.6
1.6
1.5
10.7
11.3
2.0
1.6
Pharmaceuticals
Alembic Pharma
Buy
528
648
9,948
3,101
3,966
19.7
20.5
21.4
25.5
24.7
20.7
5.2
4.3
23.0
22.8
3.2
2.3
Alkem Laboratories Ltd
Buy
1,864
2,161
22,283
5,853
6,901
17.1
18.4
74.6
85.0
25.0
21.9
5.3
4.4
21.1
20.2
3.8
3.2
Aurobindo Pharma
Buy
643
823
37,684
14,845
17,086
21.5
22.1
39.4
44.7
16.3
14.4
4.0
3.2
27.6
24.7
2.7
2.3
Aventis*
Neutral
4,041
-
9,307
2,206
2,508
16.6
16.8
128.9
139.9
31.4
28.9
5.4
4.2
21.6
23.5
4.0
3.3
Cadila Healthcare
Sell
532
450
54,489
9,220
11,584
18.4
20.3
14.5
18.7
36.7
28.5
7.8
6.3
23.5
24.6
6.2
4.8
Cipla
Sell
549
461
44,182
14,281
16,619
15.4
16.2
12.5
19.7
43.9
27.9
3.5
3.2
8.4
12.0
3.3
2.8
Dr Reddy's
Neutral
2,699
-
44,728
14,081
15,937
16.1
18.6
72.6
105.9
37.2
25.5
3.7
3.3
9.6
13.6
3.4
3.0
Dishman Pharma
Sell
143
1,718
1,890
22.7
22.8
9.5
11.3
10.1
10.9
3.3
2.9
GSK Pharma*
Neutral
2,455
-
20,794
2,927
3,290
11.8
16.2
34.4
49.6
71.4
49.5
10.4
10.8
13.9
21.3
6.9
6.2
Indoco Remedies
Sell
194
153
1,786
1,067
1,154
12.1
14.9
8.4
11.3
23.1
17.2
2.8
2.4
12.6
15.0
1.9
1.8
Ipca labs
Buy
513
710
6,474
3,211
3,593
13.9
14.5
15.4
19.4
33.3
26.5
2.6
2.4
8.2
9.5
2.1
1.9
Lupin
Buy
1,183
1,526
53,439
17,120
18,657
24.1
24.1
56.9
61.1
20.8
19.4
3.9
3.3
20.7
18.6
3.4
2.8
Natco Pharma
Accumulate
969
1,060
16,890
2,065
1,988
33.1
33.7
27.9
25.7
34.7
37.7
10.1
8.6
29.2
22.9
8.3
8.4
Sun Pharma
Buy
544
712
130,590
30,264
32,899
29.0
26.9
32.7
31.6
16.7
17.2
3.6
3.0
22.2
18.7
4.0
3.6
Power
Tata Power
Neutral
77
-
20,840
36,916
39,557
17.4
27.1
5.1
6.3
15.1
12.2
1.3
1.2
9.0
10.3
1.6
1.4
NTPC
Neutral
159
-
131,433
86,605
95,545
17.5
20.8
11.8
13.4
13.5
11.9
1.4
1.3
10.5
11.1
2.9
2.9
Power Grid
Accumulate
210
223
110,020
25,315
29,193
88.2
88.7
14.2
17.2
14.9
12.3
2.3
2.0
15.2
16.1
9.0
8.1
Real Estate
Prestige Estate
Neutral
268
-
10,048
4,707
5,105
25.2
26.0
10.3
13.0
26.0
20.6
2.1
1.9
10.3
10.2
3.3
3.0
MLIFE
Buy
443
522
2,274
1,152
1,300
22.7
24.6
29.9
35.8
14.8
12.4
1.1
1.0
7.6
8.6
2.7
2.3
Telecom
Bharti Airtel
Neutral
365
-
145,905
105,086
114,808
34.5
34.7
12.2
16.4
29.9
22.3
2.0
1.9
6.8
8.4
2.3
2.0
Idea Cellular
Neutral
77
-
27,586
40,133
43,731
37.2
37.1
6.4
6.5
12.0
11.8
1.0
0.9
8.2
7.6
1.7
1.4
zOthers
Abbott India
Neutral
4,222
-
8,972
3,153
3,583
14.1
14.4
152.2
182.7
27.7
23.1
136.2
116.3
25.6
26.1
2.6
2.2
Asian Granito
Accumulate
409
447
1,229
1,066
1,169
11.6
12.5
13.0
16.0
31.4
25.6
3.1
2.7
9.5
10.7
1.5
1.3
Bajaj Electricals
Accumulate
347
395
3,511
4,801
5,351
5.7
6.2
10.4
13.7
33.3
25.3
4.1
3.7
12.4
14.5
0.7
0.7
Banco Products (India)
Neutral
224
-
1,600
1,353
1,471
12.3
12.4
14.5
16.3
15.4
13.7
21.3
19.2
14.5
14.6
1.1
120.7
Coffee Day Enterprises
Neutral
245
-
5,040
2,964
3,260
20.5
21.2
4.7
8.0
-
30.6
2.8
2.6
5.5
8.5
2.1
1.9
Ltd
Competent Automobiles Neutral
198
-
127
1,137
1,256
3.1
2.7
28.0
23.6
7.1
8.4
38.1
34.4
14.3
11.5
0.1
0.1
Elecon Engineering
Neutral
61
-
683
1,482
1,660
13.7
14.5
3.9
5.8
15.6
10.5
3.7
3.4
7.8
10.9
0.8
0.7
Stock Watch
June 16, 2017
Company Name
Reco
CMP
Target
Mkt Cap
Sales ( Čcr )
OPM(%)
EPS (Č)
PER(x)
P/BV(x)
RoE(%)
EV/Sales(x)
(Č)
Price ( Č)
( Č cr )
FY17E
FY18E
FY17E
FY18E
FY17E
FY18E
FY17E
FY18E
FY17E
FY18E
FY17E
FY18E
FY17E
FY18E
zOthers
Finolex Cables
Neutral
503
-
7,696
2,883
3,115
12.0
12.1
14.2
18.6
35.4
27.1
18.9
16.5
15.8
14.6
2.4
2.1
Garware Wall Ropes
Neutral
849
-
1,859
863
928
15.1
15.2
36.4
39.4
23.3
21.6
4.2
3.6
17.5
15.9
2.1
1.9
Goodyear India*
Neutral
874
-
2,015
1,598
1,704
10.4
10.2
49.4
52.6
17.7
16.6
81.7
71.6
18.2
17.0
0.9
134.8
Hitachi
Neutral
2,130
-
5,791
2,081
2,433
8.8
8.9
33.4
39.9
63.8
53.4
51.4
42.9
22.1
21.4
2.8
2.3
HSIL
Neutral
381
-
2,754
2,384
2,515
15.8
16.3
15.3
19.4
24.9
19.6
24.7
21.3
7.8
9.3
1.3
1.2
Interglobe Aviation
Neutral
1,186
-
42,891
21,122
26,005
14.5
27.6
110.7
132.1
10.7
9.0
64.1
45.8
168.5
201.1
2.0
1.6
Jyothy Laboratories
Neutral
375
-
6,812
1,440
2,052
11.5
13.0
8.5
10.0
44.1
37.5
10.7
9.9
18.6
19.3
5.0
3.5
Kirloskar Engines India
Neutral
386
-
5,582
2,554
2,800
9.9
10.0
10.5
12.1
36.8
31.9
15.4
14.5
10.7
11.7
1.8
1.6
Ltd
Linc Pen & Plastics
Neutral
289
-
427
382
420
9.3
9.5
13.5
15.7
21.4
18.4
3.7
3.2
17.1
17.3
1.2
1.1
M M Forgings
Neutral
615
-
742
546
608
20.4
20.7
41.3
48.7
14.9
12.6
84.3
74.6
16.6
17.0
1.2
1.1
Manpasand Bever.
Neutral
782
-
4,474
836
1,087
19.6
19.4
16.9
23.8
46.3
32.8
5.6
4.9
12.0
14.8
5.1
3.8
Mirza International
Neutral
156
-
1,876
963
1,069
17.2
18.0
6.1
7.5
25.5
20.8
3.9
3.3
15.0
15.7
2.2
1.9
MT Educare
Neutral
65
-
257
366
417
17.7
18.2
9.4
10.8
6.9
6.0
1.5
1.3
22.2
22.3
0.6
0.5
Narayana Hrudaya
Neutral
320
-
6,543
1,873
2,166
11.5
11.7
2.6
4.0
121.0
80.8
7.4
6.7
6.1
8.3
3.6
3.1
Navkar Corporation
Buy
217
265
3,090
347
371
43.2
37.3
6.7
6.0
32.5
36.1
2.2
2.0
6.2
10.6
10.0
9.4
Navneet Education
Neutral
183
-
4,271
1,062
1,147
24.0
24.0
6.1
6.6
30.0
27.6
6.2
5.5
20.6
19.8
4.1
3.8
Nilkamal
Neutral
1,925
-
2,872
1,995
2,165
10.7
10.4
69.8
80.6
27.6
23.9
110.0
95.5
16.6
16.5
1.4
1.3
Page Industries
Neutral
16,761
-
18,695
2,450
3,124
20.1
17.6
299.0
310.0
56.1
54.1
373.3
285.0
47.1
87.5
7.7
6.0
Parag Milk Foods
Neutral
226
-
1,901
1,919
2,231
9.3
9.6
9.5
12.9
23.9
17.5
3.7
3.1
15.5
17.5
1.1
1.0
Quick Heal
Neutral
210
-
1,473
408
495
27.3
27.0
7.7
8.8
27.1
23.9
2.5
2.5
9.3
10.6
2.8
2.3
Radico Khaitan
Buy
123
147
1,634
1,667
1,824
13.0
13.2
6.7
8.2
18.5
15.0
1.7
1.5
9.0
10.2
1.4
1.2
Relaxo Footwears
Neutral
482
-
5,793
2,085
2,469
9.2
8.2
7.6
8.0
63.8
60.7
24.7
21.1
17.9
18.8
2.9
2.4
S H Kelkar & Co.
Neutral
284
-
4,112
1,036
1,160
15.1
15.0
6.1
7.2
46.6
39.6
5.0
4.6
10.7
11.5
3.8
3.4
Siyaram Silk Mills
Accumulate
2,253
2,500
2,112
1,574
1,769
12.5
12.7
97.1
113.1
23.2
19.9
3.6
3.1
15.4
15.5
1.5
1.4
Styrolution ABS India*
Neutral
861
-
1,514
1,440
1,537
9.2
9.0
40.6
42.6
21.2
20.2
54.2
49.2
12.3
11.6
1.0
0.9
Surya Roshni
Neutral
286
-
1,254
3,342
3,625
7.8
7.5
17.3
19.8
16.6
14.5
31.4
25.2
10.5
10.8
0.6
0.6
Team Lease Serv.
Neutral
1,334
-
2,280
3,229
4,001
1.5
1.8
22.8
32.8
58.6
40.6
6.3
5.4
10.7
13.4
0.6
0.5
The Byke Hospitality
Neutral
189
-
758
287
384
20.5
20.5
7.6
10.7
24.9
17.7
5.2
4.2
20.7
23.5
2.7
2.0
Transport Corporation of
Neutral
307
-
2,350
2,671
2,911
8.5
8.8
13.9
15.7
22.2
19.6
3.0
2.7
13.7
13.8
1.0
0.9
India
Stock Watch
June 16, 2017
Company Name
Reco
CMP
Target Mkt Cap
Sales ( Čcr )
OPM(%)
EPS (Č)
PER(x)
P/BV(x)
RoE(%)
EV/Sales(x)
(Č)
Price ( Č)
( Č cr )
FY17E FY18E FY17E FY18E FY17E FY18E FY17E FY18E FY17E FY18E FY17E FY18E FY17E FY18E
zOthers
TVS Srichakra
Neutral
4,048
-
3,100
2,304
2,614
13.7
13.8
231.1
266.6
17.5
15.2
454.9
358.2
33.9
29.3
1.3
1.2
UFO Moviez
Neutral
427
-
1,178
619
685
33.2
33.4
30.0
34.9
14.2
12.2
2.0
1.7
13.8
13.9
1.6
1.3
Visaka Industries
Neutral
492
-
781
1,051
1,138
10.3
10.4
21.0
23.1
23.4
21.3
63.1
59.0
9.0
9.2
1.0
0.9
VRL Logistics
Neutral
316
-
2,885
1,902
2,119
16.7
16.6
14.6
16.8
21.7
18.8
4.8
4.2
21.9
22.2
1.6
1.4
VIP Industries
Accumulate
193
218
2,721
1,270
1,450
10.4
10.4
5.6
6.5
34.4
29.6
7.1
6.2
20.7
21.1
2.1
1.9
Navin Fluorine
Accumulate
3,190
3,650
3,123
789
945
21.1
22.4
120.1
143.4
26.6
22.2
4.3
3.7
17.8
18.5
3.9
3.2
Source: Company, Angel Research; Note: *December year end; #September year end; &October year end; Price as on June 15, 2017
Market Outlook
June 16, 2017
Research Team Tel: 022 - 39357800
DISCLAIMER
Angel Broking Private Limited (hereinafter referred to as “Angel”) is a registered Member of National Stock Exchange of India
Limited,Bombay Stock Exchange Limited and Metropolitan Stock Exchange Limited. It is also registered as a Depository Participant with
CDSL and Portfolio Manager with SEBI. It also has registration with AMFI as a Mutual Fund Distributor. Angel Broking Private Limited is a
registered entity with SEBI for Research Analyst in terms of SEBI (Research Analyst) Regulations, 2014 vide registration number
INH000000164. Angel or its associates has not been debarred/ suspended by SEBI or any other regulatory authority for accessing
/dealing in securities Market. Angel or its associates/analyst has not received any compensation / managed or
co-managed public offering of securities of the company covered by Analyst during the past twelve months.
This document is solely for the personal information of the recipient, and must not be singularly used as the basis of any investment
decision. Nothing in this document should be construed as investment or financial advice. Each recipient of this document should make
such investigations as they deem necessary to arrive at an independent evaluation of an investment in the securities of the companies
referred to in this document (including the merits and risks involved), and should consult their own advisors to determine the merits and
risks of such an investment.
Reports based on technical and derivative analysis center on studying charts of a stock's price movement, outstanding positions and
trading volume, as opposed to focusing on a company's fundamentals and, as such, may not match with a report on a company's
fundamentals. Investors are advised to refer the Fundamental and Technical Research Reports available on our website to evaluate the
contrary view, if any.
The information in this document has been printed on the basis of publicly available information, internal data and other reliable
sources believed to be true, but we do not represent that it is accurate or complete and it should not be relied on as such, as this
document is for general guidance only. Angel Broking Pvt. Limited or any of its affiliates/ group companies shall not be in any way
responsible for any loss or damage that may arise to any person from any inadvertent error in the information contained in this report.
Angel Broking Pvt. Limited has not independently verified all the information contained within this document. Accordingly, we cannot
testify, nor make any representation or warranty, express or implied, to the accuracy, contents or data contained within this document.
While Angel Broking Pvt. Limited endeavors to update on a reasonable basis the information discussed in this material, there may be
regulatory, compliance, or other reasons that prevent us from doing so.
This document is being supplied to you solely for your information, and its contents, information or data may not be reproduced,
redistributed or passed on, directly or indirectly.
Neither Angel Broking Pvt. Limited, nor its directors, employees or affiliates shall be liable for any loss or damage that may arise from
or in connection with the use of this information.